


Data visualization has become a hot topic across industries. This is the same within our Clinked client base. We've been exploring the integration of data visualization systems and BI tools with our clients. They've flagged an increased need to provide real-time data access in an easy to digest way for their clients and Clinked has been able to help accomplish that. Explore how to integrate external systems, including examples, here with our team as we share how they can be used to work better for your clients.
Last week was our latest Zoominar 101! In the latest of our Clinked Zoominar series (see bottom of page for viewing) the focus was all things data visualization. Our team shared how to customize a group dashboard with data visualizations from external systems, including some of our top requests. There are numerous types of data visualizations that can be intergrated into a Clinked group to easily share data from various systems or BI Tools in one place for clients. With the options being limitless, our team focused on several rising stars per our client base including:
- Google Sheets
- Google Data Studio
- Databox
- Tableau
- Jotform
We're here now to provide a summary of our video session. Hope it will provide inspiration for those exploring integration of data sets and visualisations from external or multiple external systems to get started with your own clients.
What do we mean by data visualizations?
Data visualization means a graphical view of data and information in an easy to consume manner. Many tools have been used over the years to create visual elements such as charts, graphs and maps. These tools include systems like Microsoft Excel and Google Sheets - or, as some of you may recall, Lotus 123! These have been used as easy ways to cut data sets to uncover trends or patterns in the data sets. Recently there has been an increase in products called BI ("Business Intelligence") Tools offering advanced abilities to merge data sets from various sources in a more automated way.
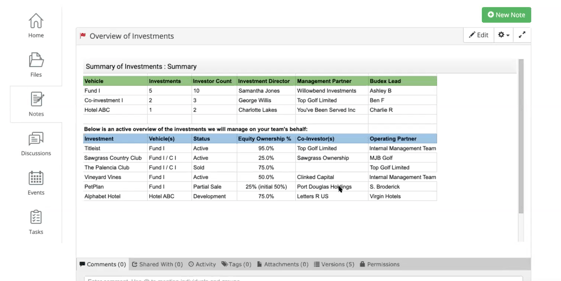
At Clinked, we considered data visualisation to include multimedia software tools such as Jotforms and Google Sheets that allow for open integration to view that graphs and charts in external systems. What does that mean? These software tools provide to ability to share via producing a private tokenized links that can be embedded into other systems. With Clinked, this integration is done in our Note tool allowing our clients to setup dashboard views for group members to easily consume and interact with to enhance collaboration in real time (i.e. rather than viewing only standard static reports) and saving time for client managers. Notes provide an easy way to share information without having to continually upload files or produce reports that quickly become outdated.
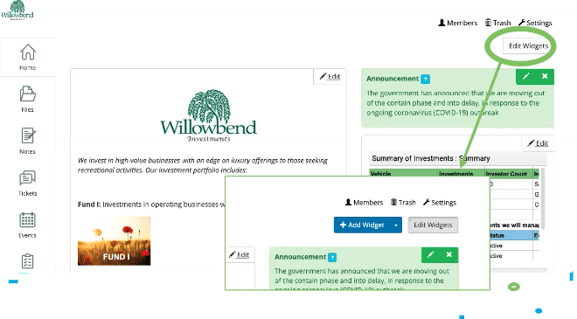
Clinked clients can explore creating these views by setting up notes and incorporating them on group homepages to provide quick access to group members. Customize a group homepage by using the ‘edit widgets’ feature to display data visualizations relevant or important to your clients needs, which they will see when first logging into Clinked.
 Can I bring data from other sources into my clients environment?
Yes, this is possible by using iframes.
What is an iFrame?
An iFrame is tool used to create & apply a private tokenized link that can be embedded into other systems. It gives access to external software systems so they can be embedded inside another system. They are utilized in Clinked for this functionality to insert a piece of content - including data visualisation, news feeds and videos - from different sources into your groups to bring relevant data into your members hands through the safety of Clinked's secure platfrom (i.e. no additional login required to access the content from other software systems).
Embedding an iFrame is the method used to insert data visualizations into a note. You would select this embedding option for articles, Google Sheets etc. However, for inserting a video select ‘embed media’ or a Jotform ‘embed Jotform’.
Find out how to create an iFrame here: https://clinked.com/features/iframes/
Google Sheets in Clinked
Google Sheets has been a key data tool for many businesses. It is also an efficient way to present data to your clients - and allows for iFrames so you can integrate data views into your Clinked groups. This integration allows you to setup notes for others (even those without a Google account) to work directly in the Google Sheet from Clinked and update the changed made in real time in both Google and Clinked. If view only is your preferred preference, that functionality is available as publish in Google Sheet so real time updates made by the Sheet owner can be viewed by the end viewer as read only. Once you've setup your Google Sheet share preference and note in Clinked, you can also display the Google Sheet in the group homepage thanks to our widget functionality and move it to where you would like (instructions on how to do this are in the Zoominar).
Google Data Studio in Clinked
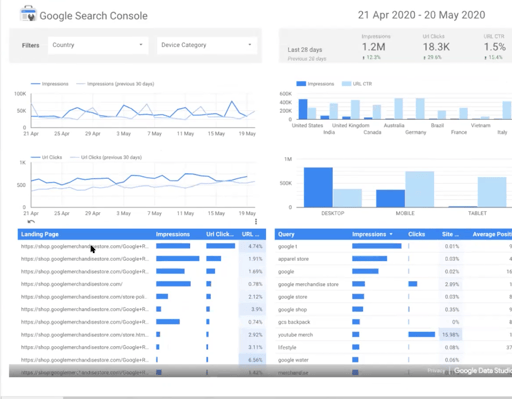
Google Data Studio is Google's answer to Microsoft Power BI. It's free, powerful and comes with a significant amount of template dashboards for quick setup. In Clinked, Data Studio dashboards are useful, particularly in terms of business intelligence. They can show what is going on across many different platforms and data sets creating an easy to integrate solution for those familiar with Google Suite.
Similarly to a Google Sheet, Data Studio dashboards can be embedded as an iframe (as pictured below). The note will link up to the Google Data Studio where the search console is hosted. You will be able to adjust and interact with the components of the dashboard directly within Clinked this way without needing to give your clients access to the underlying data sets or databases.
Databox in Clinked
Databox is a BI tool that offers direct integrations into many systems including Hubspot, Quickbooks, Google Analytics and more. Chose their templates or create your own dashboard views to provide the right dashboard view for your clients. Then share it with them in Clinked.
As shown above, Databox dashboards can be integrated into Clinked using an iframe. This useful BI tool enables you to bring a lot more content and data analysis to your clients and is presented visually. Clients should find it useful to access a large amount of data from multiple sources in one place. The dashboards can again have interact components and drop downs allowing clients access to data sets and real time analysis for direct insights within a Clinked group.
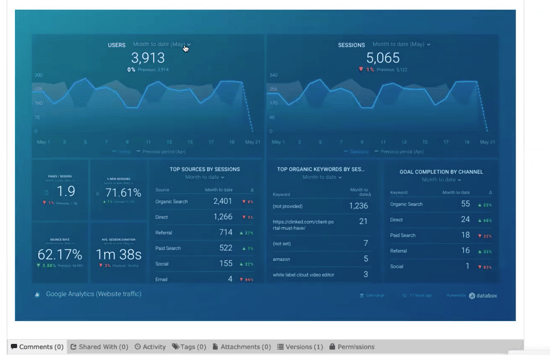 Tableau in Clinked
Tableau has become a leading tool in BI. It's become the darling in the financial service and technology industries to merge large sets of data across various sources in beautiful charts and dashboards.
This tool also provides iframe functionality allowing account owners to share dashboards in an external system, such as Clinked, to create dashboards and charts for easy access to clients. As an iframe, it is useful if you want to share a single Tableau dashboard with a client within Clinked rather than them having access to your entire Tableau account.
Jotform in Clinked
Clinked has been integrating with Jotforms and other form builder software to allow our Clinked clients to interact better with group members. For instance, if you wanted to create an application, RSVP or registration form this can be created in Jotform then inserted into Clinked as a note for integration to a group homepage for group members to complete as part of workflow. Using forms in this way means that keeping track of long email chains of event invites and responses is no longer necessary. Responses entered by clients through a form in the homepage can be automatically placed into a Google Sheet and updated manually when necessary.
Pro tip: Speaking of updating data manually, to improve data quality and reliability, you can utilize email validation in google sheet to ensure that the email addresses added to the sheet are valid and formatted correctly. This helps in maintaining accurate contact information and enhances communication efficiency within the group.
Hope this gives you some ideas of how you can use data visualisations in Clinked to deliver more to your clients! These are just several examples of iframe integrations, but there are many more sites which will work in a similar way.
See these examples explored with our team during our latest Clinked Zoominar below:
Curious to explore further? Arrange a time to speak with our team:


Let Us Know What You Thought about this Post.
Put your Comment Below.